
Coming Soon in Faculty Search: Advanced EEO/Diversity Reporting on Applicant Pool
Building a diverse faculty but not sure how it’s going? Knowing whether you’re on track to meet your institution’s EEO and diversity goals is easier than ever with Interfolio’s new diversity reporting options. The upcoming Advanced EEO/Diversity Reporting feature in Interfolio’s Faculty Search module will allow users at your institution with EEO permissions to access comprehensive data analyses and visualizations within the module. This will provide immediate visual insight into candidate pools over user-set time ranges, allowing EEO Officers to monitor diversity goals and Institutional Administrators a new level of ease in understanding the hiring process for any given position.
What's changing?
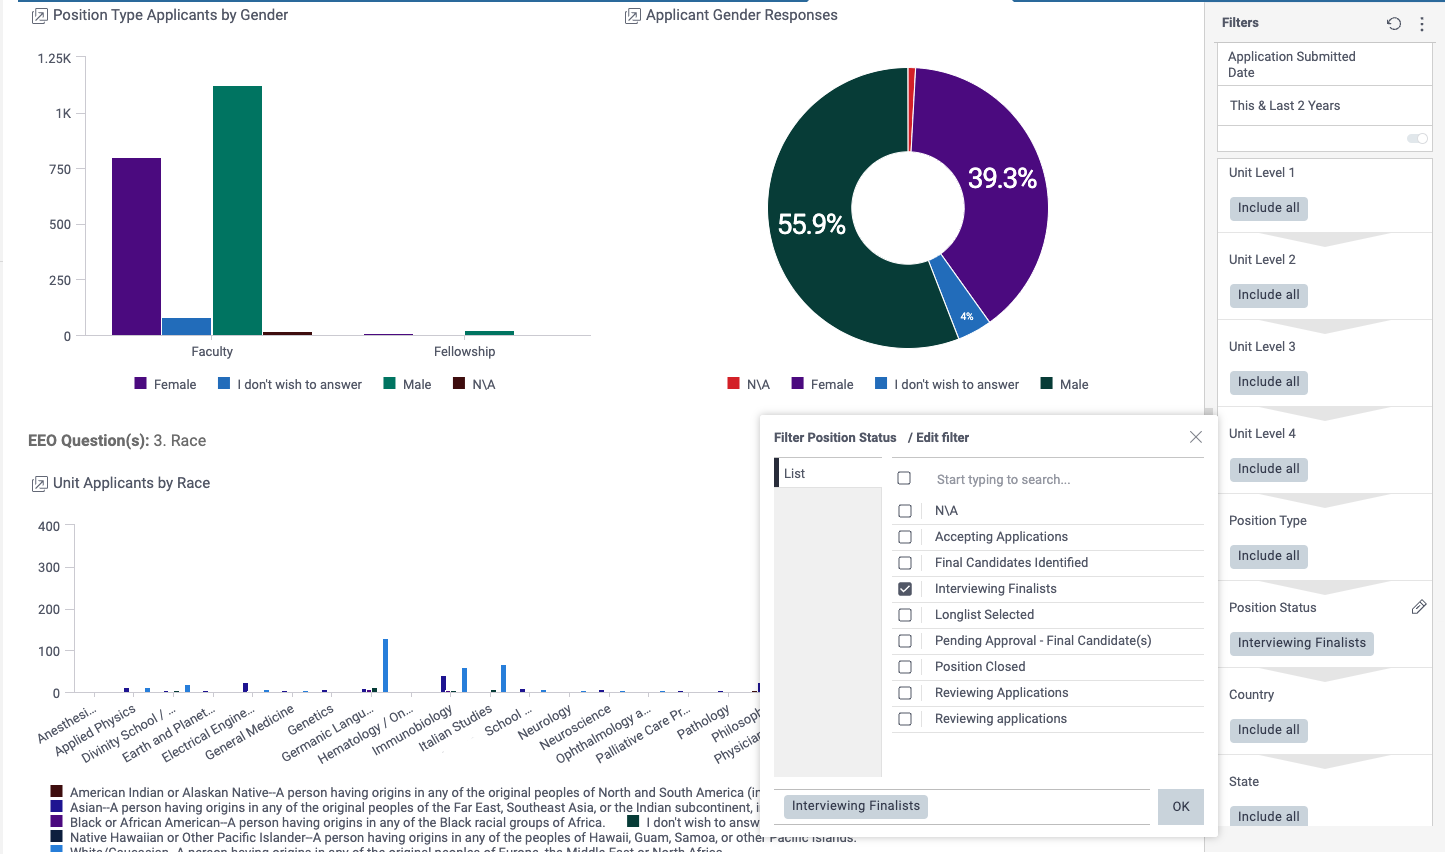
The addition of an “Advanced Reports” tab to the “Reports” page in Interfolio Faculty Search will allow greater flexibility in analyzing and viewing data about position applicants. With the new tab, you will be able to filter data to include in an analysis, presented in various visual formats. This new tab is available only to users with permission to view EEO data, including EEO Officers and Institutional Administrators.
- The user will be able to view various demographic data categories in a chart or graph format for at-a-glance comprehension of the data. This data can be downloaded as visuals or in a CSV format for further analysis.
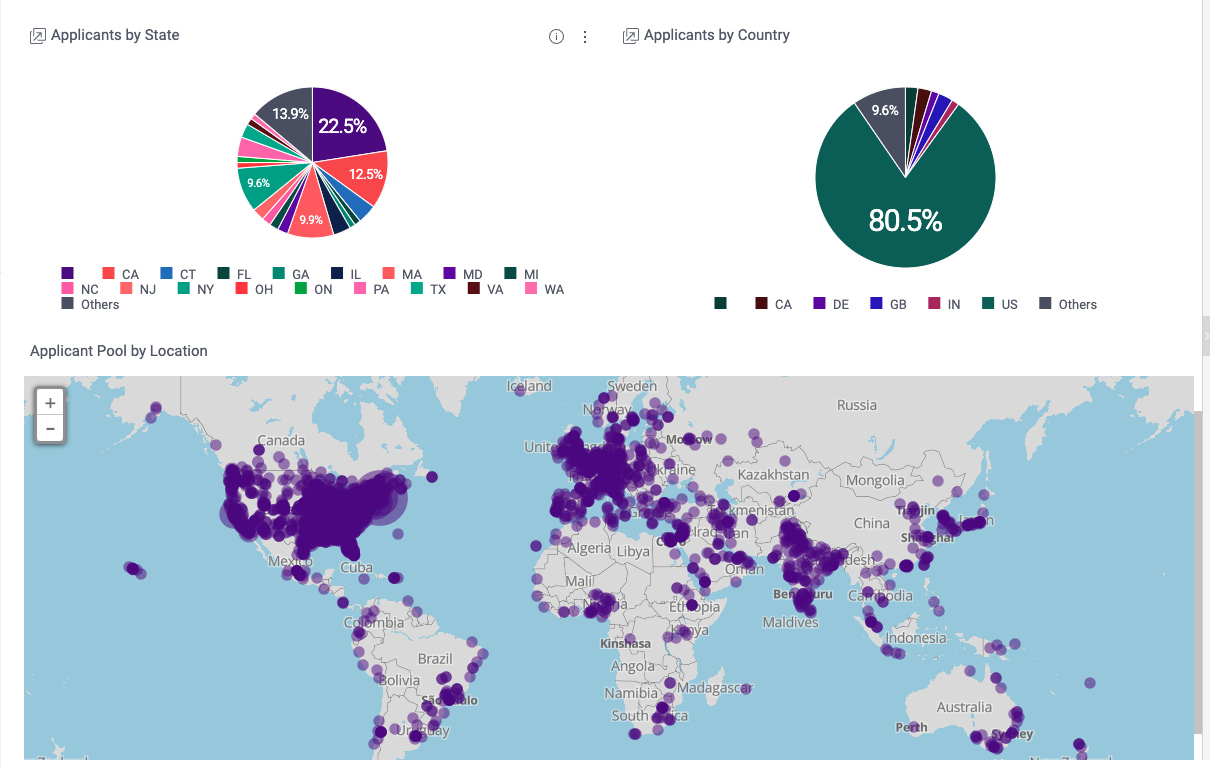
- Once this feature is active, historical data will be available to view applicant trends over time. For example, you could view a quarterly report of positions created by status or type, to see the year’s hiring trends. You could view a heat map illustration of candidate applicants by location to see the global impact of your recruitment efforts. You can see the breakdown of applicants for each step of an open position, to see if your applicant pool demographics dramatically shift from one step to the next.
More Details
- EEO Form responses will be viewable on two tabs, Standard EEO Responses and Custom EEO Responses. If your institution uses the Standard form, data will populate in that tab. If your institution modifies the EEO form preloaded in Interfolio, your data will appear in the Custom Reports tab. The other tab will remain empty.
- Data visualizations include heat maps for applicant locations, pie charts, graphs, line graphs, and tables.
- Institutional Administrators will get a bird’s-eye view of the data and can narrow down information by unit.
When will this change happen?
This change is currently anticipated for release to all clients by the end of 2022. As always, timelines may be updated if needed.
Facilitating diverse and inclusive faculty hiring is an important aspect of any academic institution’s success. We believe this new feature in Interfolio's Faculty Search will provide applicant insights and actionable data to help you understand and update your hiring processes to best meet your goals.